
InfoSync · Enterprise reporting platform redesign
A solo redesign of the reporting platform behind 100+ restaurant brands, from a 20-year-old flat list to a role-based product.
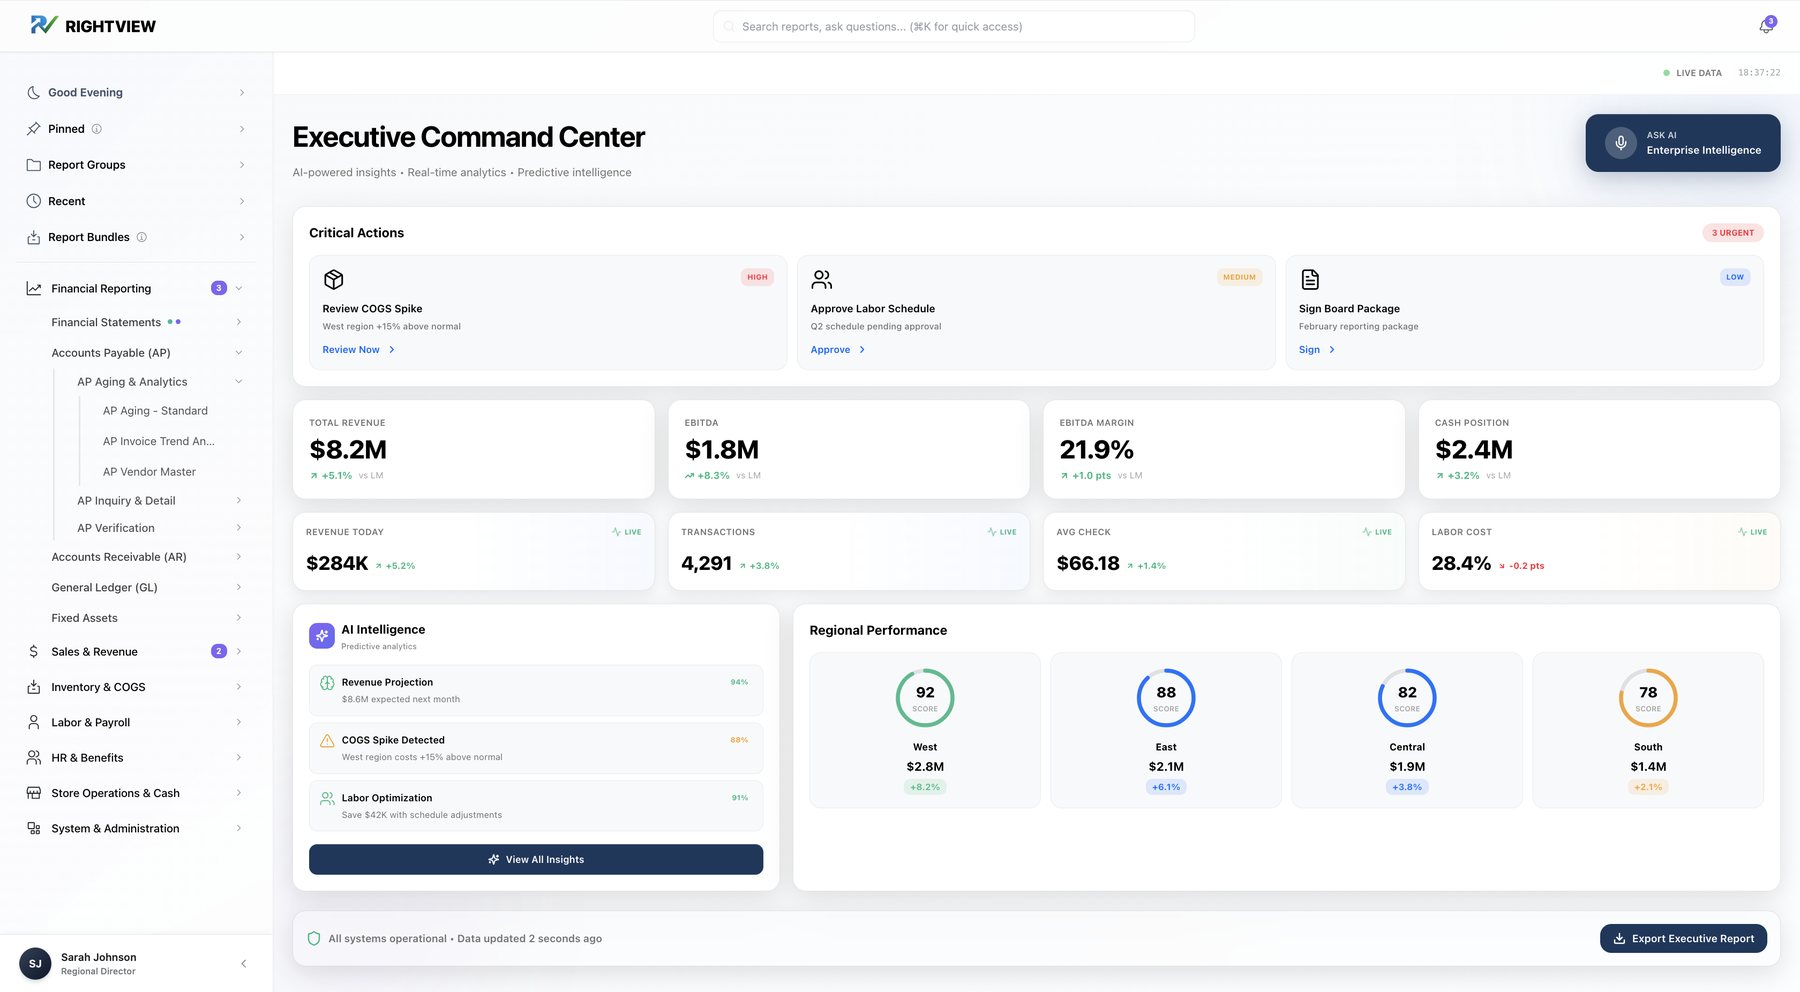 After · Executive
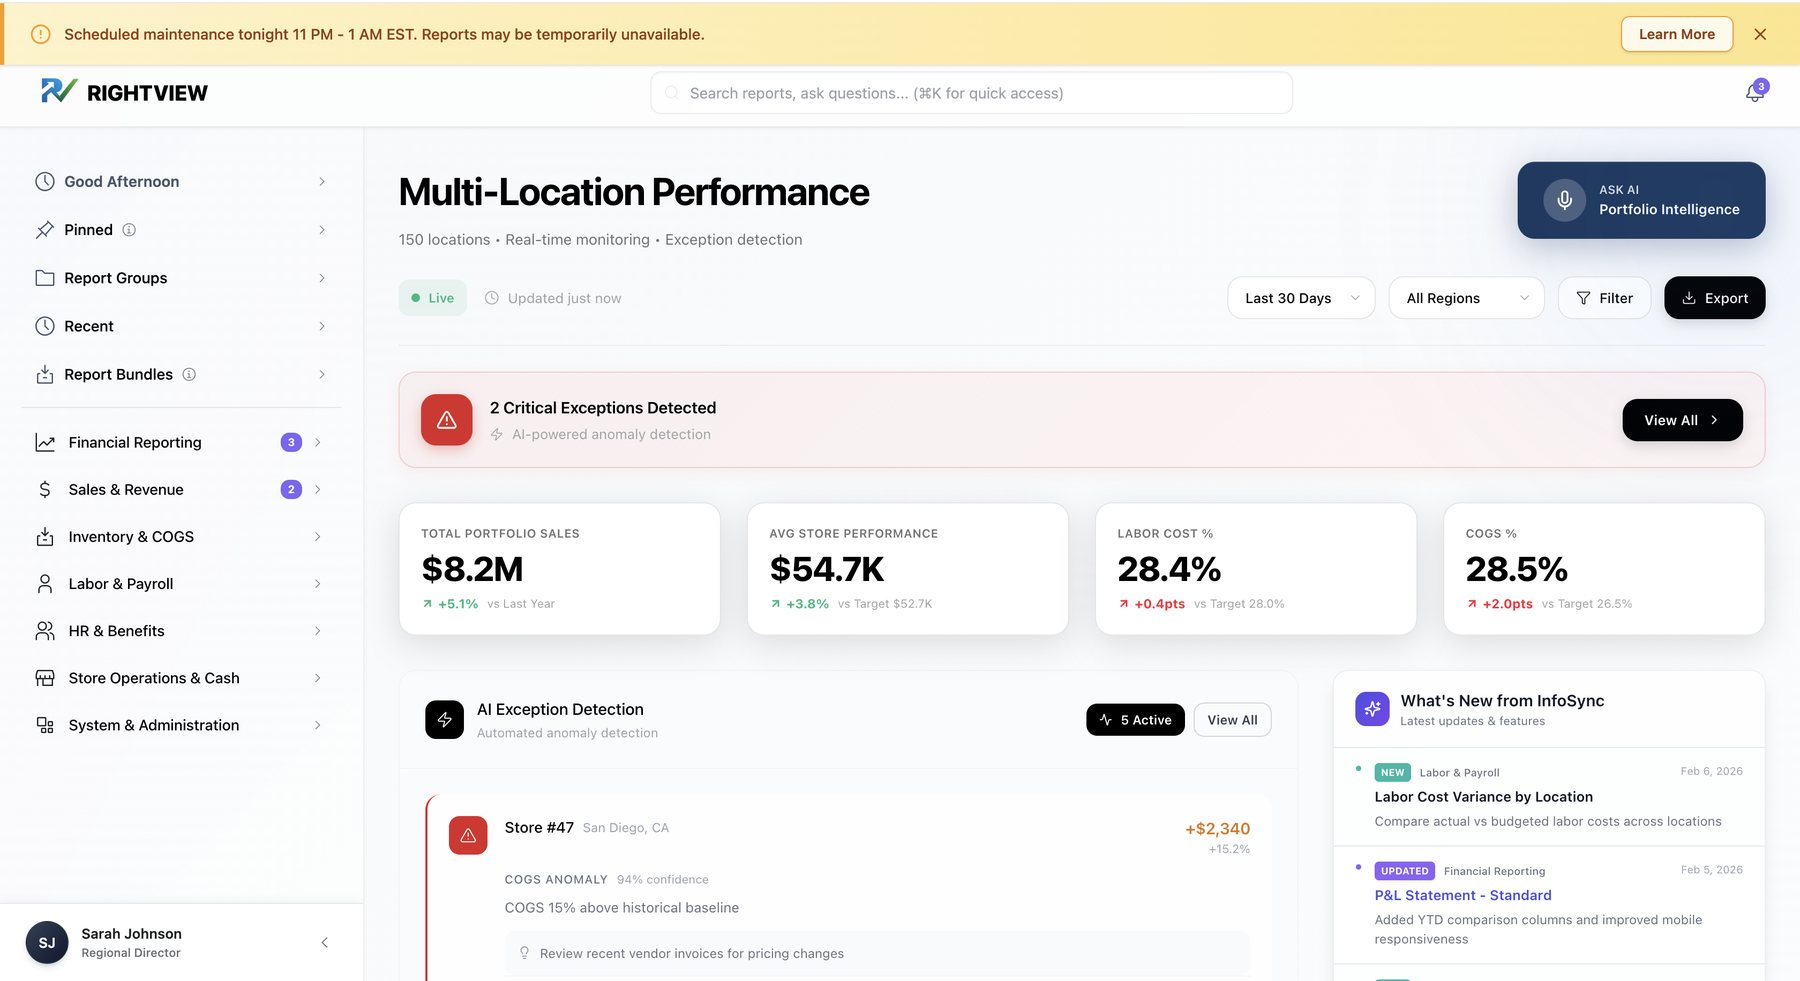 After · Regional Director
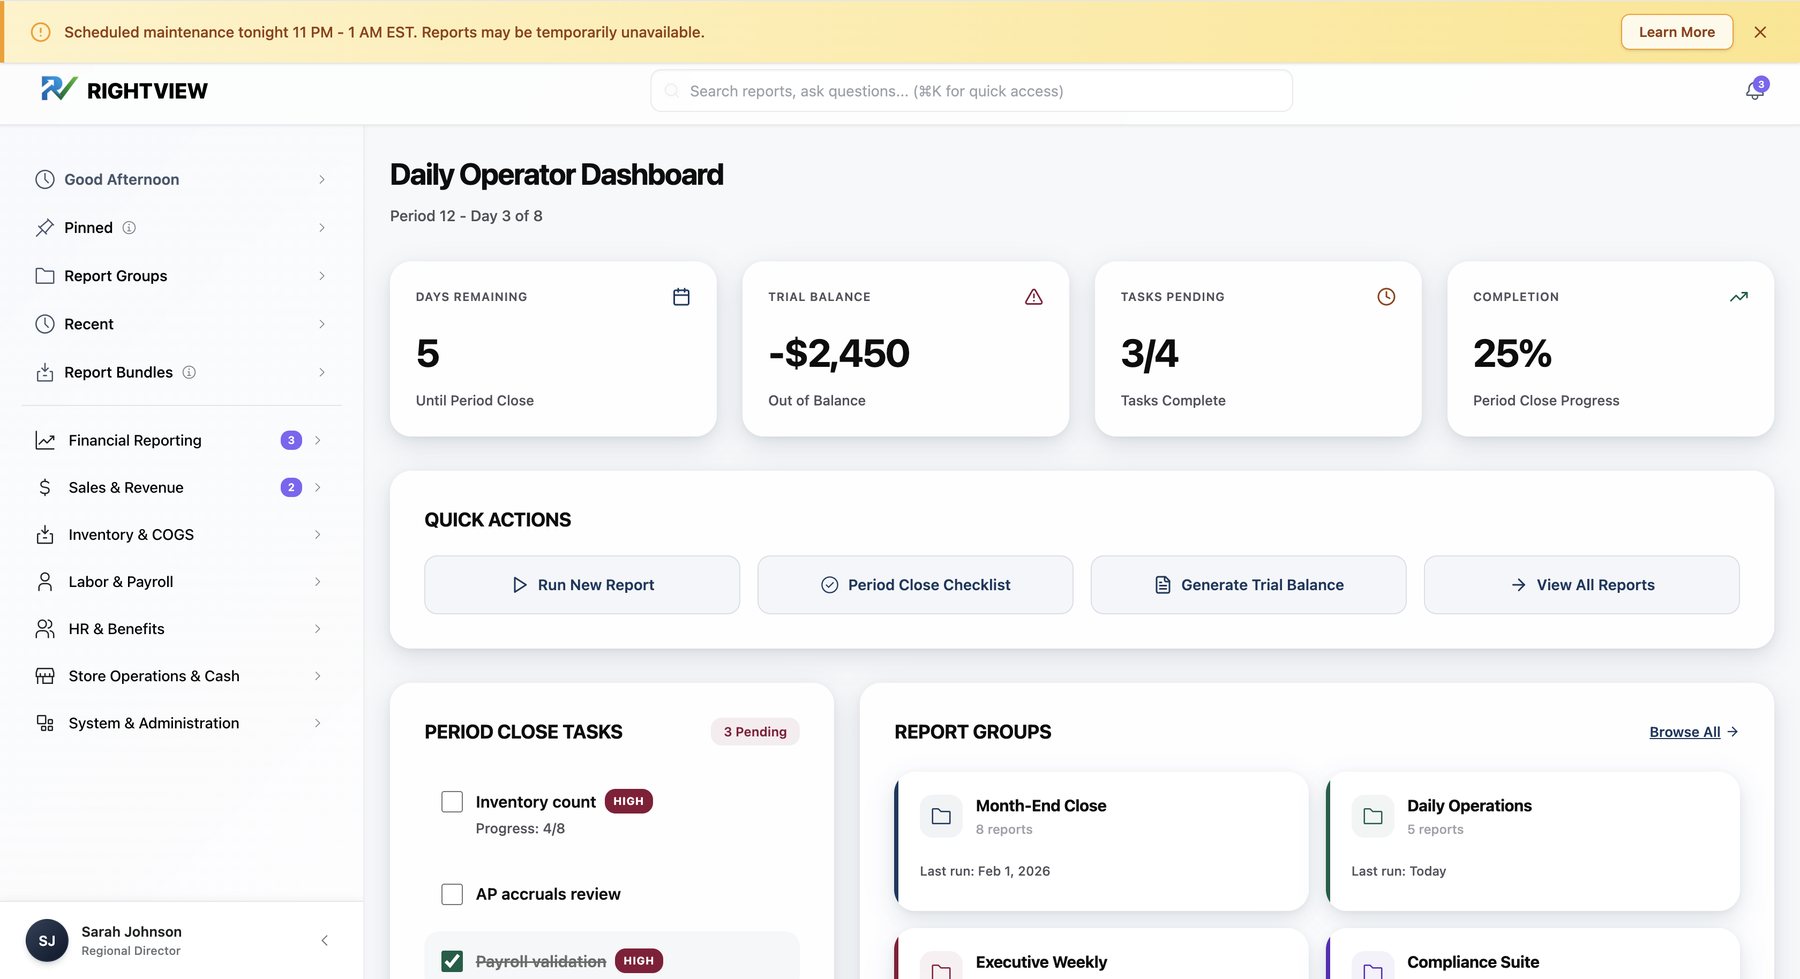 After · Controller
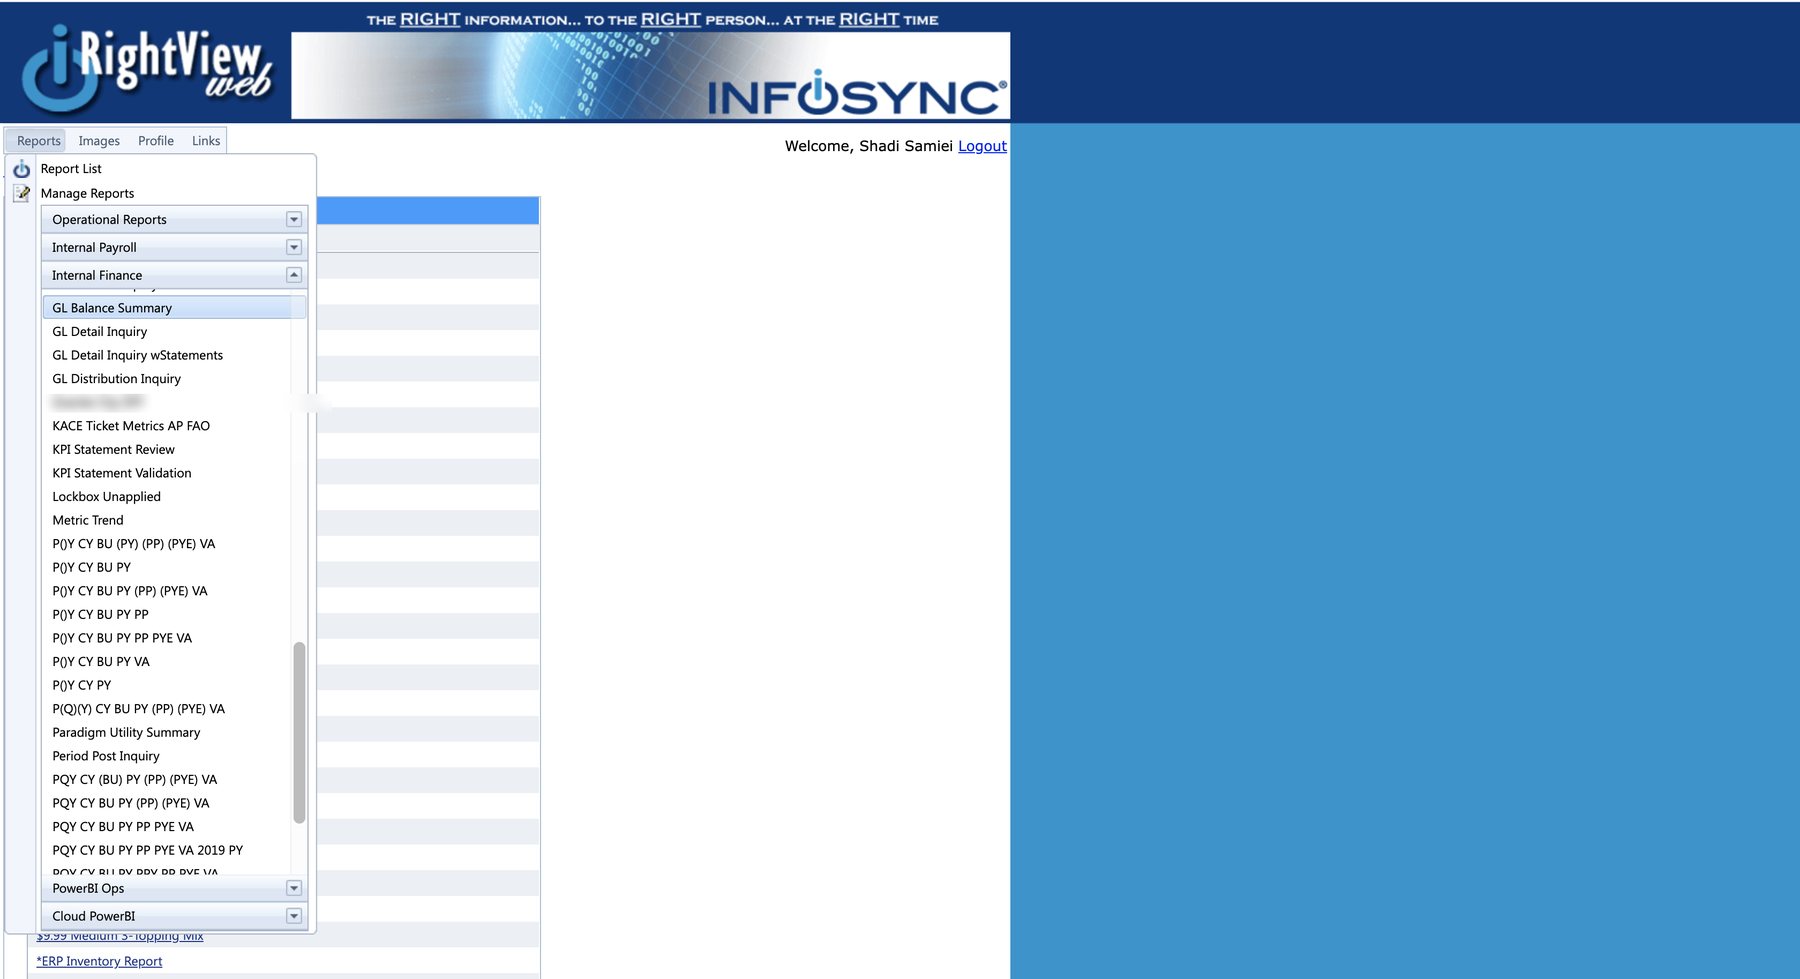 Before · the old report menu
The short version
Growth had slowed and clients were leaving. Leadership believed the platform just needed to look modern.
Research showed a structural problem: 889 reports nobody could find. I refocused the work on information architecture first.
17 interviews, an AI-assisted report analysis, a recommended 4-level IA and four role-based dashboards in a 20+ screen prototype.
A recommended IA that takes 889 reports to ~280, and dashboards built around each role's decisions. Leadership moved forward to implementation, with the CTO as the project's champion.
Role
Senior UX Designer, solo
Timeline
Jan–Mar 2026
Users
629 staff + clients
Tools
Figma Make, Figma, AI
Chapter 1 of 5 · The problem
RightViewWeb is how InfoSync delivers reporting to 100+ restaurant brands across 11,000+ locations. After 20 years of engineering-led development, growth had slowed and some long-time clients were leaving. Leadership's theory: the product looked dated. Once I watched people use it, the real issue was clear. It wasn't how it looked. People couldn't find anything.
Old report menu ↔ new Daily Operator dashboard
Before
After
889 reports in one flat list, many of them client-specific copies
No search. Even 15- and 18-year veterans used Ctrl+F
670 clients in every dropdown, only ~200 still active
30-minute timeouts with no explanation
No documentation. Knowledge passed person to person
No overview. Executives dug through reports to see how the business was doing
"Clients also don't know what they don't know… they don't even know that we have report options out there that they could use."
Chapter 2 of 5 · Discovery
I ran 17 interviews over 18 sessions (15 internal staff, 2 franchise clients) and a 40-response client survey, and watched people work in the live system. All 15 internal participants named the same core problem: finding things. And 12 of 15 (80%) had built their own custom report groups just to cope.
interviews, plus 40 client surveys
internal users struggled to find reports
12 of 15 users had built their own report groups
pain points logged and triaged
Report groups grew with tenure: a newer controller had 1, an 18-year managing director had 12.
Design can solve 31 · needs backend 20 · configuration 7 · process change 5
Separating these kept design effort where design could move the needle, and gave engineering a clear list of its own.
The obvious move was to define users by their roles and permissions. That's where the platform's history got in the way. RightViewWeb was built around personalization: when someone needed to do something, they were given a permission for it, and when they came back needing something else, another permission was added. For years that was the selling point, because the system fit each customer's needs. After 20 years it had become the problem. Access was customized person by person, with no pattern to standardize and no way to clean up navigation without breaking someone's setup.
I analyzed InfoSync's internal security export: 733 user accounts. The thousands of client-side users weren't in any data I could access; the team described their access as granted request by request, the same way.
internal user accounts analyzed
unique security groups
permissions per user (average 92)
of users held 100+ permissions
So I built a two-layer model. The security data set the base layer: five access categories the team could actually administer. The interviews set the second layer: four archetypes defined by what people are trying to get done, not by their job title. Navigation stays the same for everyone; dashboards follow the archetype, and people can switch or customize them because many users span more than one.
Layer 1 · Access, from the security data
System Administrator 289 · Specialist (payroll, finance, operations) 139 · Location Manager 169 · Departmental Manager 115 · Executive 21
Internal accounts by access category, out of 733
Layer 2 · Purpose, from the interviews
Daily Operator runs the same reports to a deadline · Multi-Location Monitor needs to know where to look first · Strategic Reviewer needs the business at a glance · System Administrator configures and supports
I synthesized interviews in three batches of five, updating a pattern tracker after each batch, then checked the patterns against the client survey and the security categories.
| Archetype | Batch 1 | Batch 2 | Batch 3 | Client survey | Closest access category |
|---|---|---|---|---|---|
| Daily Operator | 4/5 | 5/5 | 3/5 | 50% | Specialist (finance, payroll) |
| Multi-Location Monitor | 5/5 | 5/5 | 5/5 | 75% | Departmental Manager |
| Strategic Reviewer | 2/5 | 2/5 | 2/5 | 12.5% | Executive / Strategic |
| System Administrator | 0/5 | 3/5 | 5/5 | n/a (internal only) | Administrative |
The Multi-Location Monitor showed up in every single interview, which made it the core client market. The System Administrator only appeared once I reached IT and support staff in later batches, a reminder that early batches can hide whole user groups.
Not every user fits one box. A controller and a payroll specialist are both Daily Operators but run on different cycles (monthly close vs. bi-weekly payroll), so the Daily Operator got sub-types with different default widgets.
How I worked
Reviewing 889 reports and ~12,000 pages of research by hand wasn't possible in the time I had. I built a prompt system that analyzed the transcripts and the full report inventory, and used it to produce a recommended structure as a starting point. Judgment and validation stayed with me.
1 Enrich
Transcripts coded with behavior and navigation context.
2 Analyze
Multi-pass prompts for pain severity, a 127-task inventory and report patterns.
3 Recommend
A mapping of every report to a proposed new home and name.
4 Validate, me
Every output checked against source; weak proposals rejected.
The AI was fast, but it worked from documents, not from the people I'd watched. These are four places where its proposal sounded reasonable and was wrong.
AI proposed
A 6-category structure with Cash Management as its own category and HR folded into Labor & Payroll.
I pushed back
Cash means two different jobs: month-end reconciliation for controllers and daily deposit checks for store managers. And HR isn't payroll: as one interviewee put it, "PTO is not technically payroll."
Result
Cash split by purpose; HR & Benefits became its own category. Seven categories.
AI proposed
One fixed dashboard per archetype, with users switching between dashboards.
I pushed back
"Simply switching dashboards is not helpful for users who need several things from several archetypes. Jumping from one dashboard to another might be too complicated."
Result
One customizable dashboard per person: defaults by job title, widgets from a role-based library.
AI proposed
A single Daily Operator dashboard built around the monthly period close.
I pushed back
"Controller needs a period close status tracker, but a payroll specialist has bi-weekly deadlines. Both fit Daily Operator but need different widgets."
Result
Daily Operator sub-types with their own cycles and default widgets.
AI proposed
A data model where everyone has "clients" with "locations", InfoSync's internal vocabulary.
I pushed back
"A 40-location franchise owner doesn't have clients. They have branches, units, maybe multiple restaurant brands."
Result
Terminology and selectors redesigned around how each user describes their own business.
Chapter 3 of 5 · Six decisions
Decision 1 of 6
The brief was a UI refresh: up to 5 mid-fidelity screens, with detailed IA out of scope. Two days into the system, it was clear that new screens on this structure would demo well and fail in daily use. I walked leadership through what research showed and refocused the project on information architecture and navigation first, then on the screens that would help each role act faster.
Decision 2 of 6
This is the heart of the project, and it wasn't a matter of taste. Every step of the structure came from the report inventory, the interviews, or the 67 report groups users had built for themselves.
Step 1
Find the patterns in the inventory
An AI-assisted pass over the full report export found that 40–50% of reports were client-specific copies, 10–15% looked deprecated, and the rest fell into recognizable families: ~150 sales mix reports, ~200 client flash reports, ~80 labor reports.
Step 2
Compare three structures
Incremental cleanup (fast, keeps the debt), a full categorical restructure (scalable, ignores recurring tasks) and task-based collections only (natural for routines, bad for one-off reports). I recommended a hybrid: categories for browsing, task-based groups and bundles on top, search across everything.
Step 3
Test the categories against real behavior
The first model had 8 categories; a leaner 6-category version followed. Both were checked against the report groups users had built and the interview evidence, and both broke in places, which is how the final 7 came about.
Step 4
Map every report to a home
A 4-level structure (7 categories, 32 subcategories, 47 report groups, ~280 reports) and an 842-row migration map from every old report to its proposed new home and name. Seven top-level categories also stays within the 7±2 range people can scan comfortably.
Every square is ~3 reports in one alphabetical list. Orange marks client-specific copies of the same report.
7 categories → 32 subcategories → 47 report groups → ~280 reports. The largest category holds ~90 reports, against ~800 in the old Operational folder.
98 → 5
Client flash reports → templates with a client filter
35 → 2
KPI reports → templates with customizable widgets
33 → 1
Price-point reports → one template with a price filter
| Category | Where it came from |
|---|---|
| Financial Reporting | The ~100 "Internal Finance" reports already formed a coherent set used by controllers for statements, GL, AP and AR. Kept, and split into 5 subcategories. |
| Sales & Revenue | ~150 sales mix and ~40 promotion reports, mostly one report per price point or promo. Consolidated into templates with filters. |
| Inventory & COGS | ~60 inventory reports, many client-specific; COGS variance was a top exception directors asked about. |
| Labor & Payroll | ~80 labor reports plus payroll processing; payroll specialists work bi-weekly cycles distinct from finance close. |
| HR & Benefits | Split from payroll after interviews: "PTO is not technically payroll", and one user's PTO workflow spanned 24 reports. |
| Store Operations & Cash | ~200 client flash reports, daily cash and ~30 exception reports: the daily store view, separate from month-end finance. |
| System & Administration | IT and support metrics that had been filed under Payroll, plus admin tools for the largest access group (289 of 733 internal accounts). |
| Old report | New home | New name | Why |
|---|---|---|---|
| P()Y CY BU PY VA | Financial Reporting › Financial Statements › P&L Reports | Profit & Loss – Standard View | Cryptic codes (CY, BU, PY, VA) became filters |
| AP Aging AOD wAPDetail | Financial Reporting › Accounts Payable › AP Aging & Analytics | AP Aging – Standard | "AOD" (as of date) became a date filter |
| $10 Any (Price – NO Coupon) Sales Mix | Sales & Revenue › Menu Mix › Product Analysis | Menu Mix – Price Point Distribution | Price-point copies became one template |
| Daily Hourly Analysis | Store Operations & Cash › Store Performance › Daily Flash | Store Flash – Daily Summary | Client flash copies became one template |
| Turnover Analysis | HR & Benefits › Turnover & Retention | Turnover Analysis | Moved out of payroll |
| KACE Tickets Closed Last Month | System & Administration › IT Support Metrics | KACE Tickets Closed Last Month | Was filed under Payroll by mistake |
The full map covers 842 reports across 7 columns, with a summary by category and a consolidation log.
Decision 3 of 6
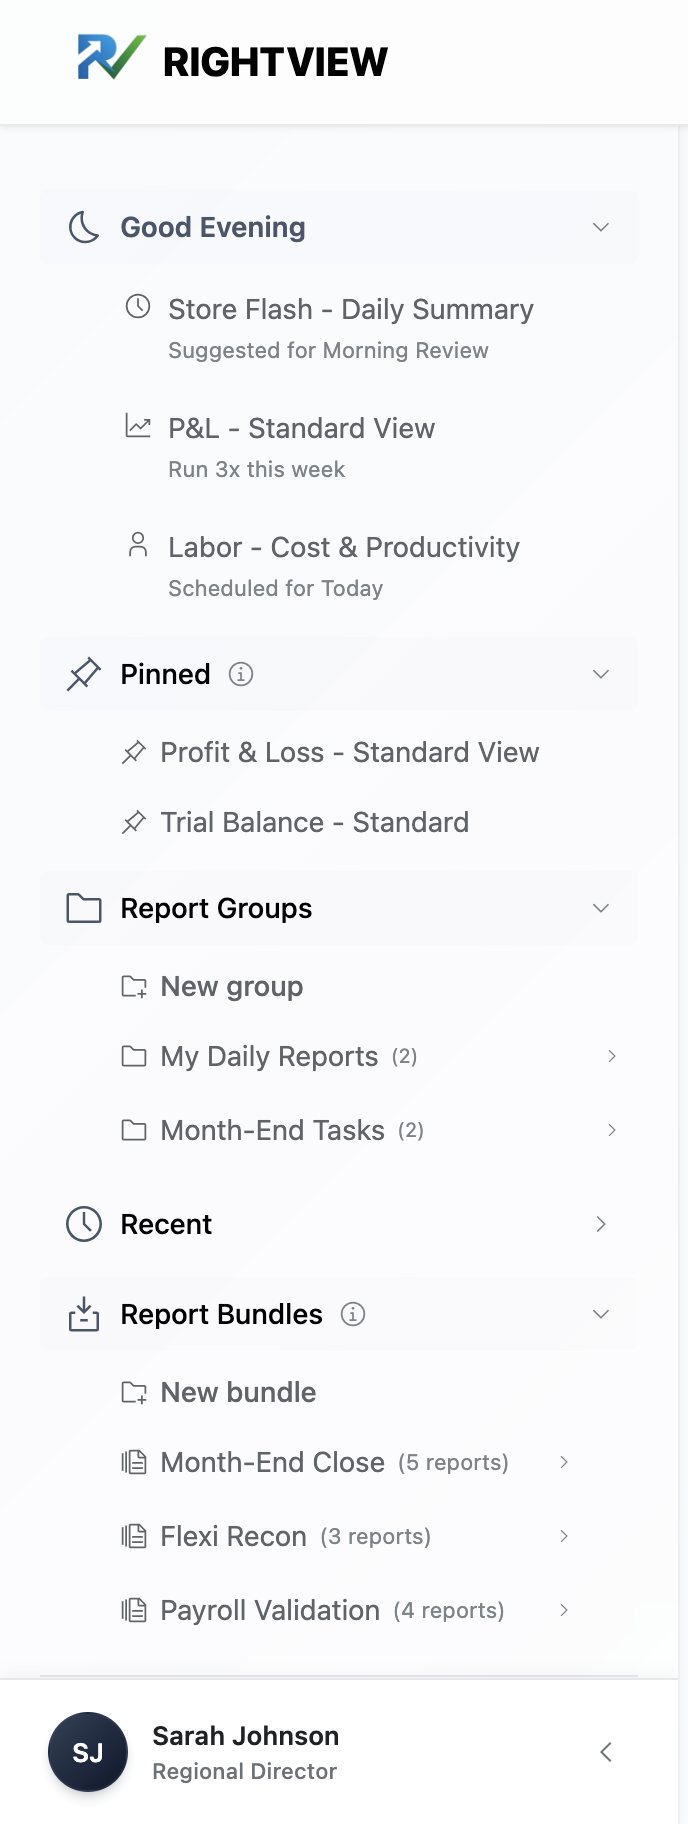
Instead of treating custom report groups as misuse, I made them primary navigation. The sidebar leads with a time-aware greeting that suggests likely reports, then pinned reports, report groups, recents and one-click bundles, with the categories below and search on every screen.
A naming call. I kept "Report Groups" rather than "Custom Groups". The risk wasn't the label; it was that people didn't know they could make their own. A visible New group action does that job.
Discovery built in. Colored dots mark categories with new or updated reports, and a notification center explains what changed.
Decision 4 of 6
This went beyond the brief. Research showed executives and directors digging through reports to answer simple questions: where are we losing money, which stores need attention, where should we invest? So each role got a dashboard built around its decisions. Switch roles to see each one, the way the prototype's login does.
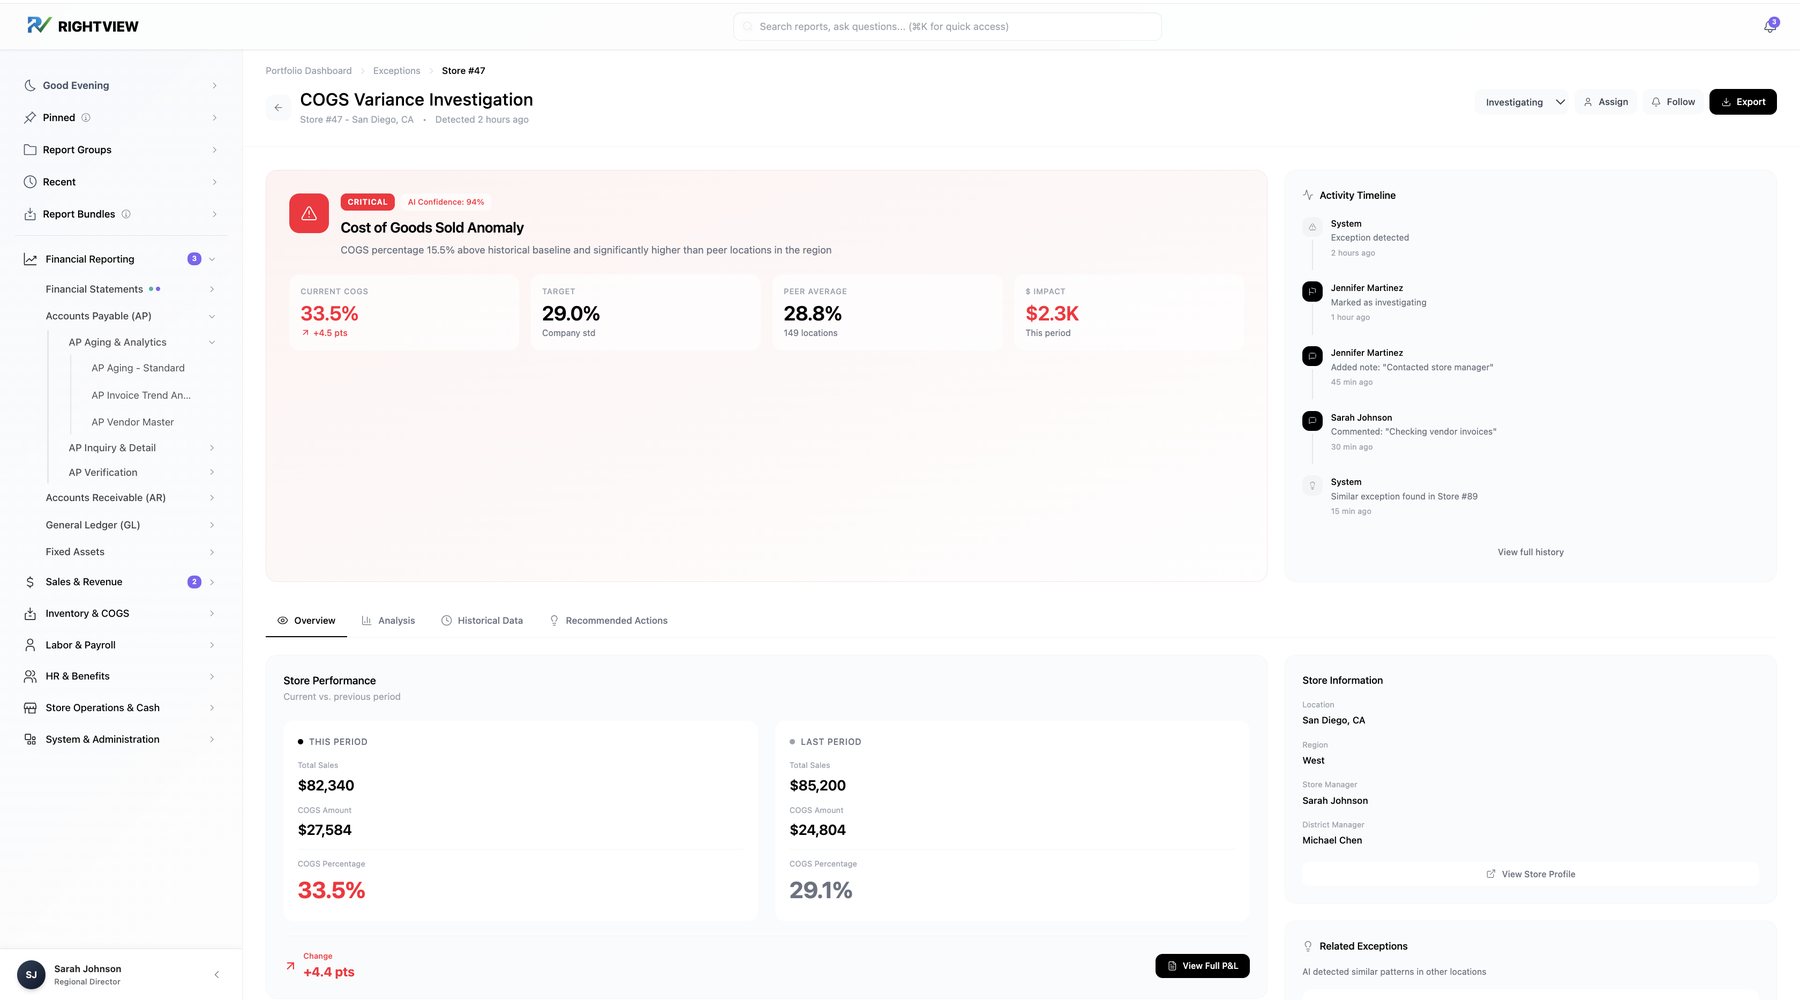
Drill down and follow up. An exception opens an investigation: status, assign, follow, notes and a full activity timeline.
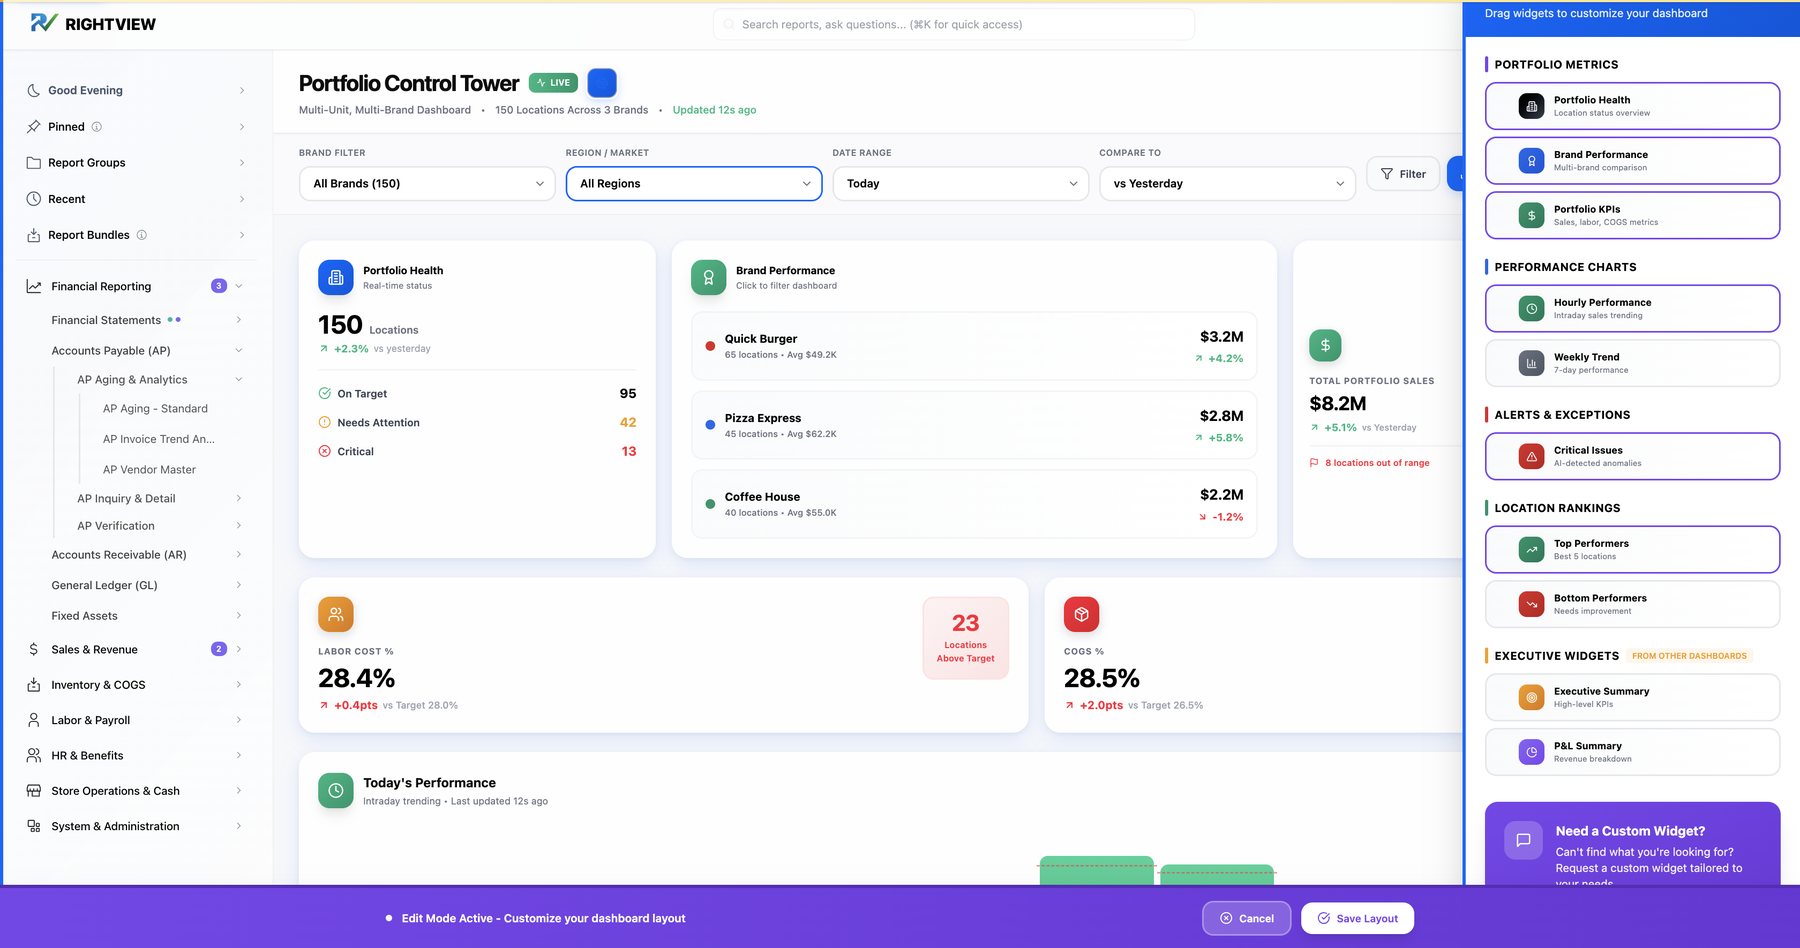
Make it yours. Add, remove or borrow widgets from other dashboards, or request a new one by describing what you need to see.
"Eyeballing it… [a] human could easily miss something."
Decision 5 of 6
Timeouts needed engineering work with no quick fix. Design couldn't make reports faster, but it could stop wasted runs and set honest expectations. Report setup became a guided flow (location, period, comparison) with active clients only, a summary of exactly what will run and an estimated run time before you commit.
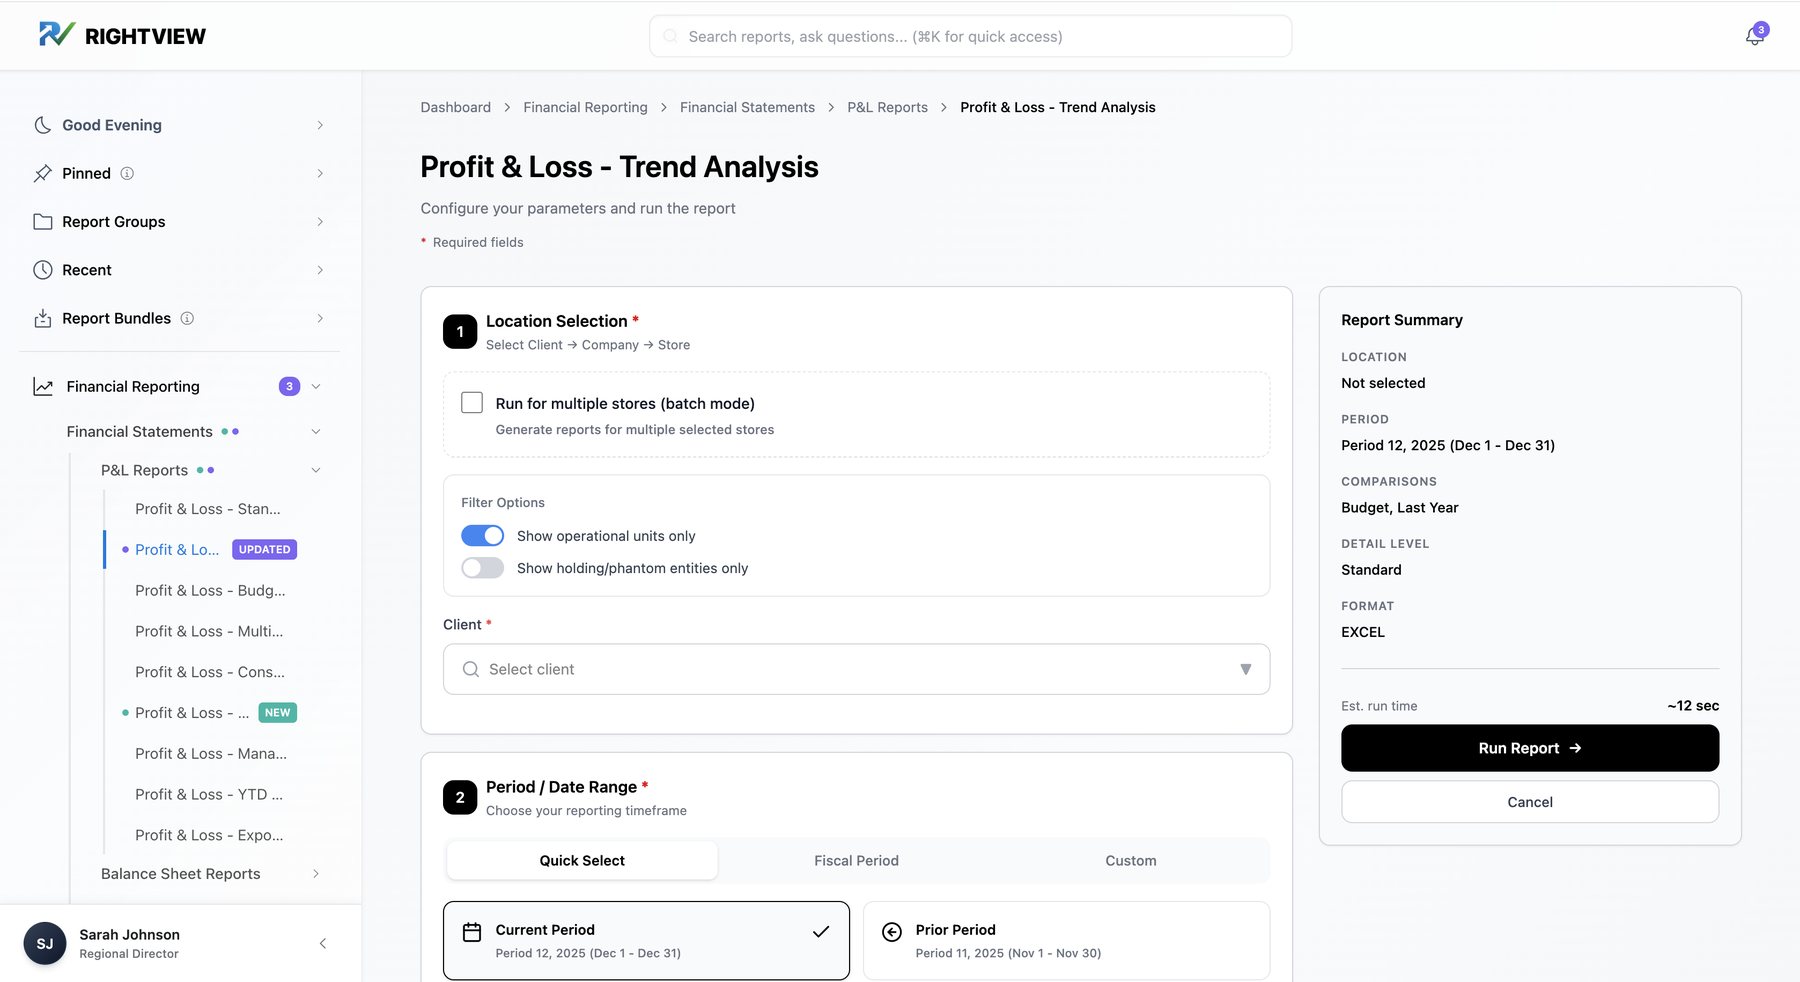
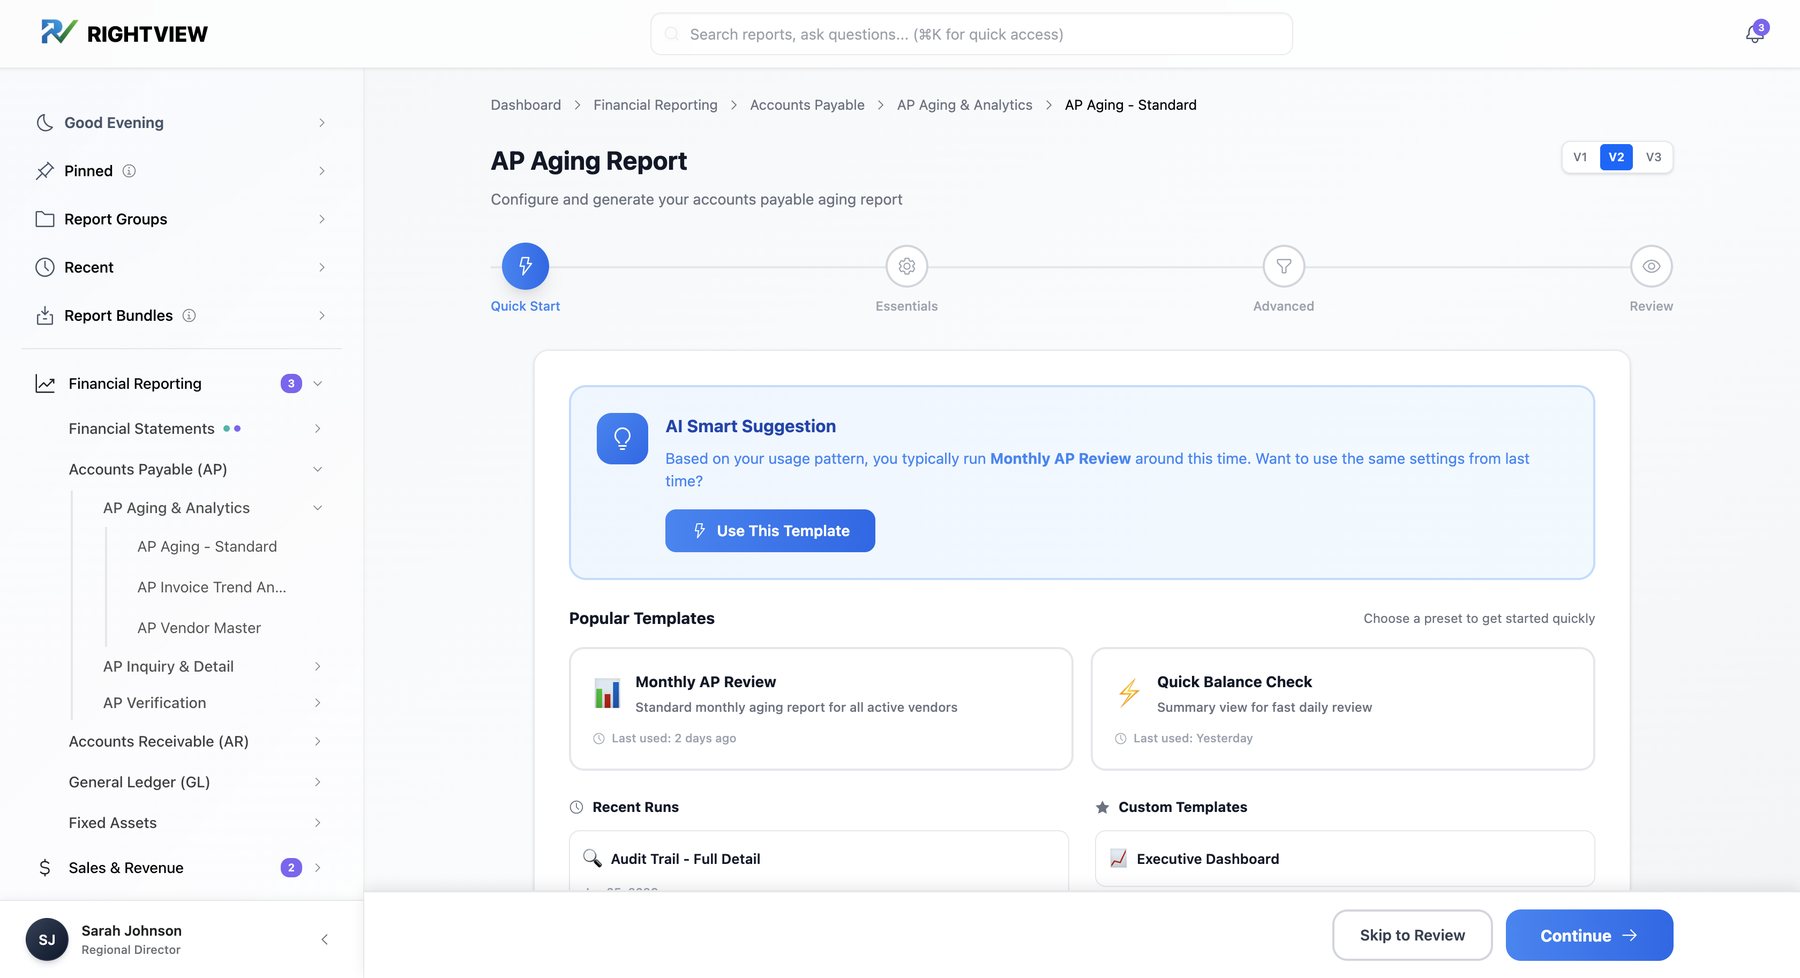
One AP Aging report instead of three, with a concept AI suggestion to reuse last month's settings.
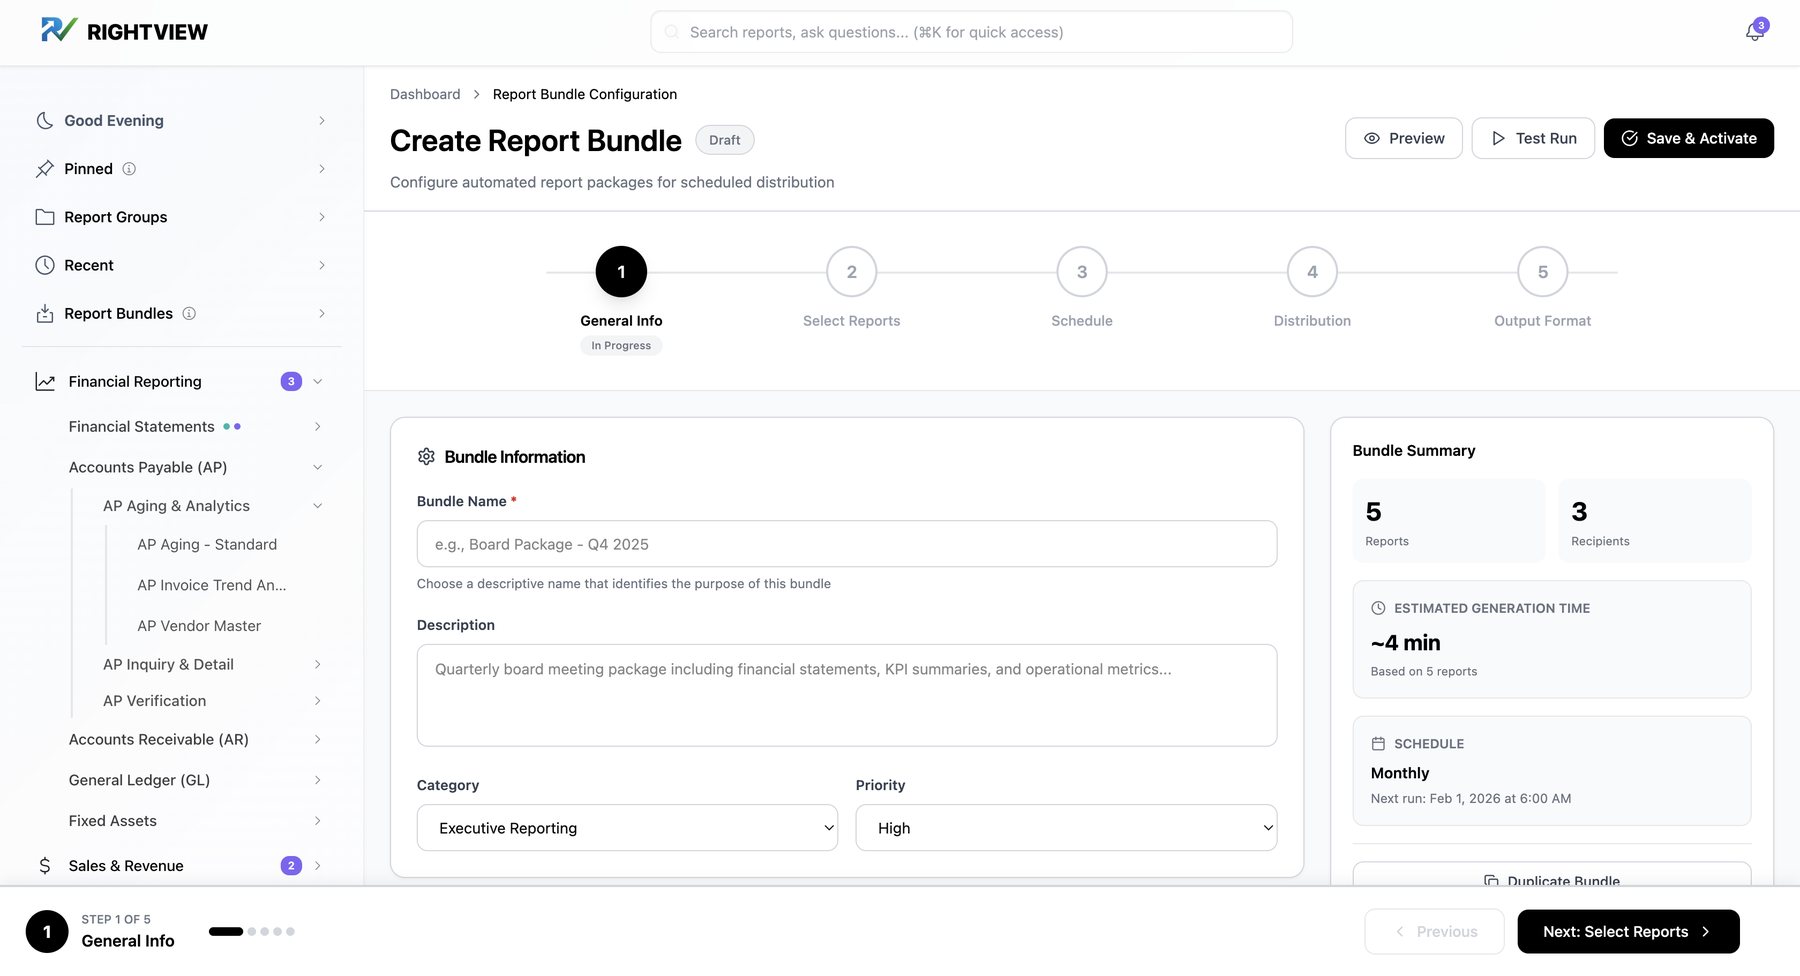
Batch and schedule. Recurring packages, like a month-end close set, generated and delivered in one action.
"Clients see a report and they have to go and change their filters every single time."
Decision 6 of 6
The prototype is high-fidelity in interaction but deliberately neutral in visual style. Early polish pulls feedback toward "I don't like the blue" instead of "I can't find what I need." I built competing versions on purpose, such as search in the sidebar vs. at the top and three AP Aging forms, ready for A/B testing. While designing, I put work in progress in front of IT, finance staff and managers and watched them use it.
Chapter 4 of 5 · The product
Nothing in the prototype is decoration. Pick a pain point to see the evidence behind it and what I designed in response.
Pain point
Evidence
Design response
Where to see it
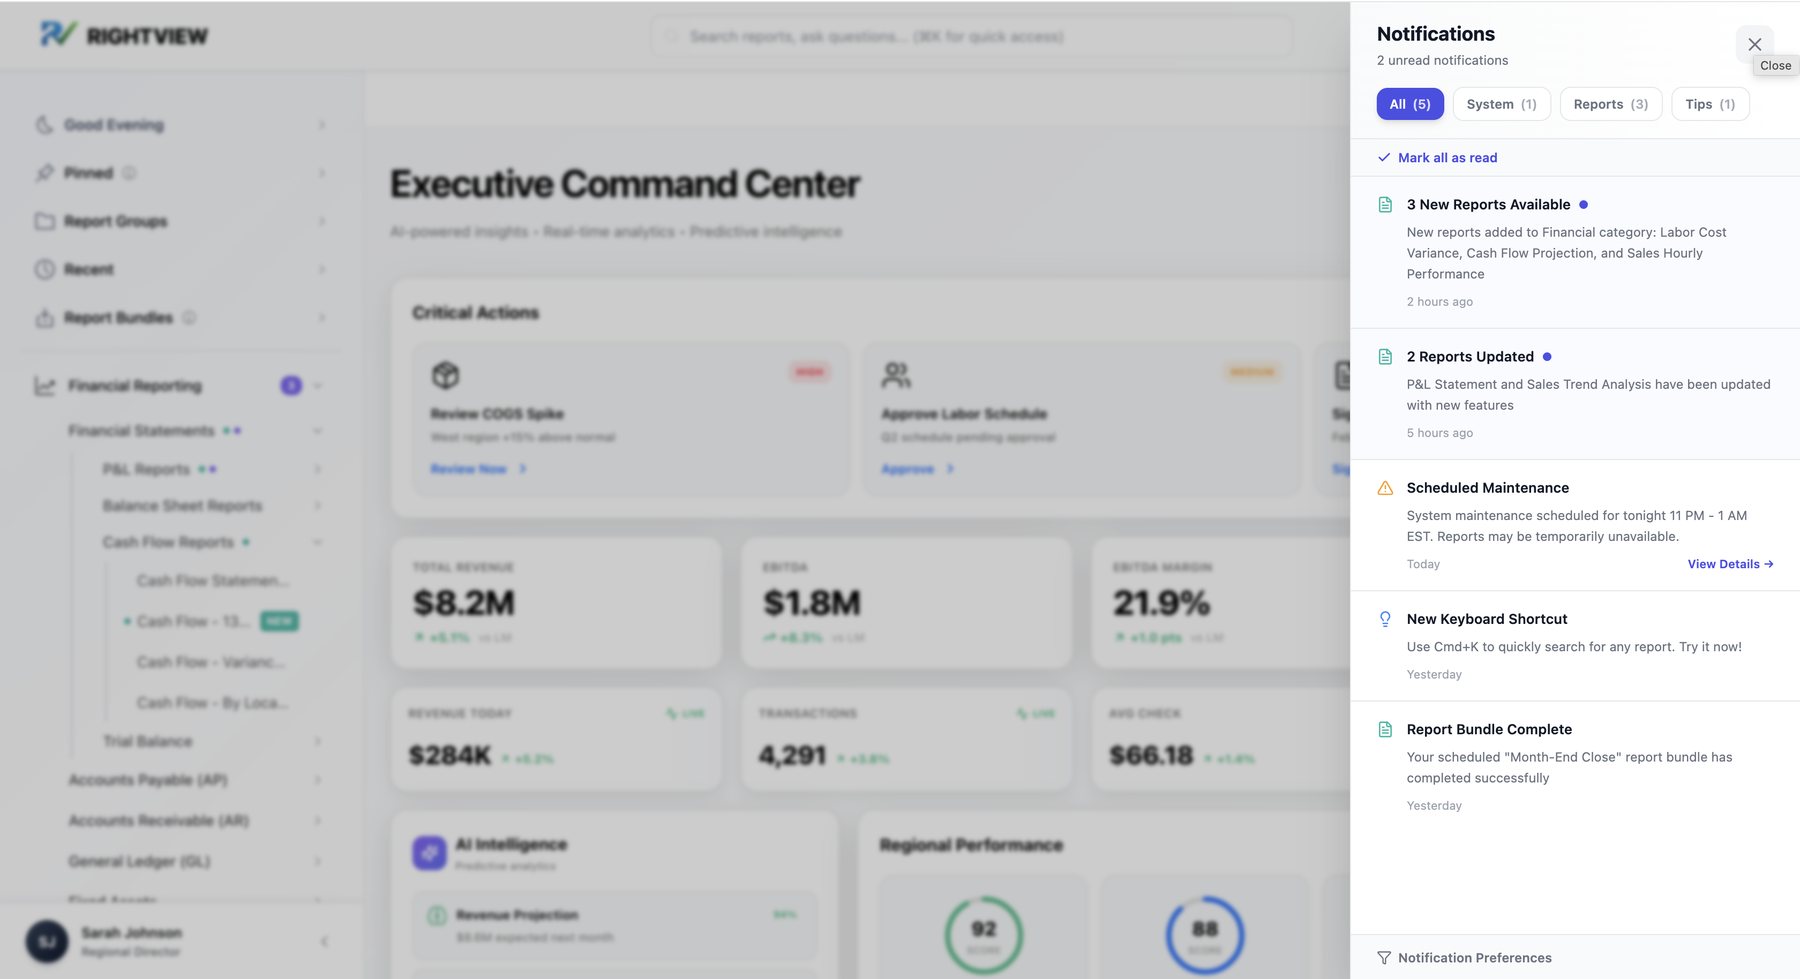
Notification center. New and updated reports, maintenance windows and tips, filterable by type.
Chapter 5 of 5 · Outcome
Research: 17 interviews, 40 surveys, 63 pain points, a 127-task inventory
Structure: a recommended 4-level IA and a migration map for 889 reports
Product: a 20+ screen interactive prototype covering four roles end to end
Handoff: an IT Implementation Playbook and Dashboard Design Guidelines
Strategy: a dual-track roadmap presented to the CEO, COO and CTO
Ready to test: competing versions prepared for A/B testing
Track 1 · Now
UX overlay on today's platform
New navigation, IA and dashboards without a rebuild.
Track 2 · Next
Future-state platform
A rebuild on a central data warehouse, with this research and structure as its foundation.
Leadership's response at the final presentation was overwhelmingly positive. The CTO and IT leadership, who had pushed for a UX budget in an engineering-led company, were the work's strongest champions. The company chose to implement first and fund usability testing once it saw early results.
The structure came before a single screen, and made every screen possible.
When 80% of users build the same one, it's a design problem, not a behavior problem.
To much of the company, UX meant prettier pages. Part of the job was showing it's about how the product works.
The structure is a research-backed recommendation. Next: task-based testing across all four roles.
Thanks for reading
Click through the prototype, or let's talk about the research behind it.